
Diversity Data 2025

FGSA

solicitor-advocate witney

francis george solicitor-advocate is committed to providing equal opportunities in employment. This means that all job applicants and employees will receive equal treatment regardless of sex, marital status, sexual orientation, socio-economic background, age, religion, race, colour, nationality, ethnic or national origins, or disability. 


Pie chart showing age distribution of employees across a firm, divided into age groups: 16-24 (35%), 25-34 (25%), 35-44 (20%), 45-54 (10%), and 55-64 (10%).
Bar chart titled 'Number of staff within each category' with categories: Chartered Legal Exec CILEX Practitioner, IT/Hr/Other corporate services role, Managerial role, Role directly supporting a fee earner, Other fee earning role, Solicitor (not partner), Salaried or partial equity solicitor partners. The chart shows the number of staff in each category with horizontal bars, with the highest count for IT/Hr/Other corporate services and Other fee earning role, and the lowest for Managerial role.
Pie chart displaying gender distribution in an organization, with 15% male and 85% female.
Pie chart titled 'Employees considered to have a disability' showing 10% Yes and 90% No.
Bar chart titled 'Staff Ethnicity breakdown' showing five categories: 'Any other white background,' 'White British/English/Welsh/Scottish,' 'White and Black African,' 'Pakistani,' and 'Bangladeshi.' The longest bar representing 'White British/English/Welsh/Scottish' indicates it is the most common ethnicity in the data.
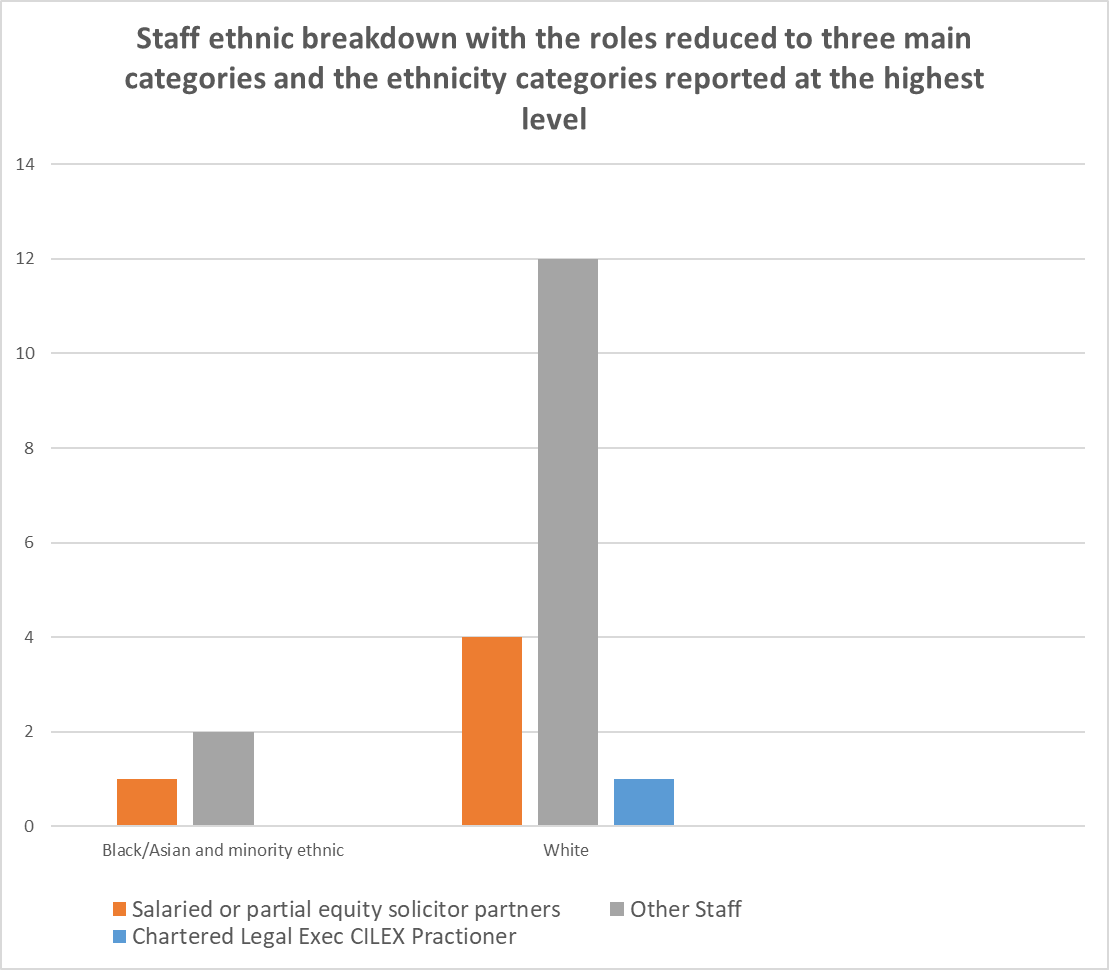
Bar chart showing staff ethnic breakdown by role and ethnicity. The chart indicates that most 'Other Staff' are White, with fewer Black/Asian and minority ethnic staff. 'Salaried or partial equity solicitor partners' and 'Chartered Legal Exec CILEX Practitioner' are primarily White, with some minority representation.
Pie chart showing the type of school attended by employees aged 11 to 16. The chart indicates that 90% attended state-run or state-funded non-selective schools, 5% attended independent or fee-paying schools with bursaries covering over 90% of tuition, and 5% are not sure.
Pie chart showing the occupation of employees' main household earners when they were 14. The chart segments are labeled with percentages and colored: blue for modern professional and traditional professional occupations, orange for senior, middle, or junior managers or administrators, gray for technical and craft occupations, yellow for routine, semi-routine, manual, and service occupations, light blue for small business owners, and green for prefer not to say.
Pie chart showing percentage of staff within each socio-economic background category: 60% professional background, 10% intermediate background, 30% lower socio-economic background.
Pie chart showing employees who are primary caregivers for a child under 18, with 40% Yes and 60% No.
Pie chart titled 'Employees who look after/care for someone with a long term physical/mental health disability'. The chart shows 95% labeled 'No' and 5% labeled 'Yes, 50 or more hours a week'.

It is a requirement by The Solicitor’s Regulation Authority (SRA) that firms publish diversity data every 2 years.